



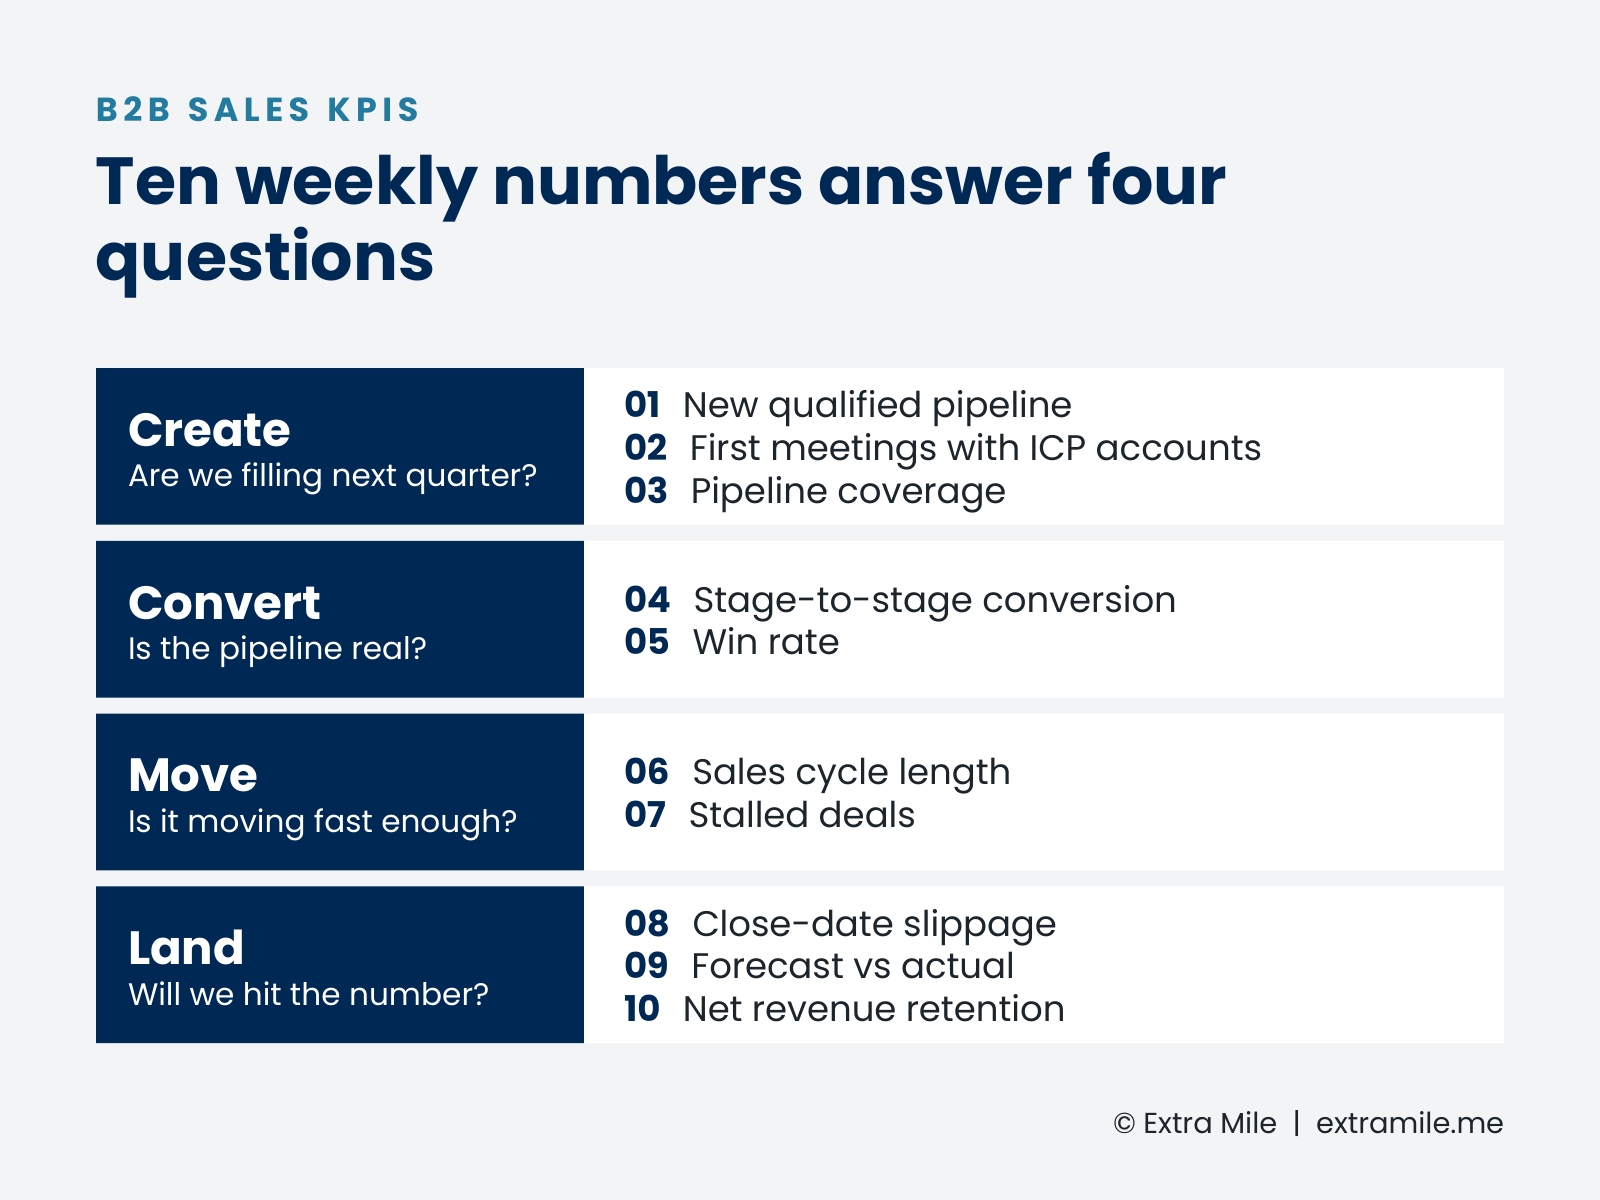
Most founders don’t lack sales data. They lack a short list of B2B sales KPIs that tell them what to do on Monday morning. The ten metrics in this guide answer four questions: are we creating enough pipeline, is that pipeline real, is it moving, and will we land the number? Review them every week in about 30 minutes, give each one a written definition and an owner, and move anything that never changes a decision to a monthly report.
In this article
- Why dashboards rarely change decisions
- Pipeline creation
- Stage conversion
- Cycles and stalled deals
- Variance
- The 30-minute weekly review
- Start with definitions
- Sources and further reading
Why sales dashboards rarely change decisions
A growing sales team usually ends up with a CRM dashboard of thirty or forty charts. Leaders scroll through it, nod, and run the business on instinct anyway. The trouble starts before the dashboard: with the data going in. In Salesloft’s 2026 US Revenue Benchmark, a vendor survey of 500 US sales and revenue decision-makers, 55.6% said the information in their CRM is based mostly on subjective seller reporting, and only about a third said they could instantly diagnose why a deal had stalled (Salesloft, 2026).
A weekly review should do three jobs: show whether the next two quarters are being built, expose deals that aren’t real, and give an honest call on the current quarter. Ten numbers cover those jobs. They sit on top of the wider system described in our guide to building a B2B revenue engine, and they only work if that system’s stages and definitions are clear.
One rule before the list. Write down the definition of every metric and agree it with the team. If “qualified” means one thing to one rep and something looser to another, week-on-week comparisons are meaningless, however good the dashboard looks.
Pipeline creation: are we filling next quarter?
Pipeline created this week mostly decides revenue one or two quarters from now. That makes these the leading indicators founders most often neglect, because this quarter’s deals always feel more urgent.
1. New qualified pipeline created
The value and number of opportunities that passed your qualification gate this week, split by source (outbound, inbound, partners, referrals, expansion). Set the weekly target by working backwards from next quarter’s goal.
Illustrative example: a company needs $600,000 of new annual recurring revenue next quarter and historically wins 25% of qualified pipeline by value. It needs $2.4 million of qualified pipeline, or roughly $185,000 created every week across a 13-week quarter. Track the count as well as the value: a few oversized, optimistic deals can make a thin week look healthy.
2. First meetings with ICP accounts
The number of first conversations held with accounts on your target list, by rep and by source. This is the earliest signal you have; when it drops, new pipeline follows a few weeks later. Count only accounts that match your ideal customer profile, or the number rewards activity over relevance.
3. Pipeline coverage
Open qualified pipeline due to close this quarter, divided by the target still to be won. The common “3x” rule is only a rough shortcut. Required coverage is roughly one divided by your win rate: a team winning 25% of qualified pipeline needs about 4x, while one winning 40% needs about 2.5x. Coverage also counts stale deals at full value, so read it alongside metrics 7 and 8.
Stage conversion: is the pipeline real?
4. Stage-to-stage conversion
The share of opportunities leaving each stage that move forward rather than being lost. It shows where deals die: a drop after discovery points to qualification, a drop after the proposal points to pricing, value or the decision process. Small teams have small numbers, so one lost deal can swing a weekly figure. Use a rolling 90-day window, look at the trend every week and act on a change that holds for a month.
5. Win rate
Deals won divided by deals won plus lost, measured from a fixed stage (for example, from qualified), by count and by value, over a rolling 90 days. Leave open deals out of the calculation, and record a loss reason every time, or you learn nothing from the number.
Resist the urge to compare your figures with published benchmarks. Studies measure different things in different populations. Ebsta’s 2025 GTM Benchmarks, vendor research based on 655,000 opportunities worth $48 billion, reported that 78% of sellers missed quota, up from 69% a year earlier (Ebsta, 2025). RepVue’s Cloud Sales Index, built on self-reported ratings from sellers at 249 US cloud companies, put attainment at just over 43% in the third quarter of 2025 (RepVue, 2025). Salesloft’s 2026 survey put average quota attainment at around 62%. Your own trend, measured the same way each week, is the only benchmark that tells you what to do.
Cycles and stalled deals: is the pipeline moving?
6. Sales cycle length
The median number of days from qualification to close for deals won in the last 90 days. Use the median, because one 18-month enterprise deal distorts an average. Compare it with the cycle of deals you lost: if losses take longer than wins, the team is holding on to deals it should have disqualified earlier.
7. Stalled deals
Open opportunities with no buyer interaction or no next meeting booked in the last 14 days, or that have sat in one stage for well over their usual time. Report the count and the value. For most small teams this is the most useful number in the whole review, because each stalled deal has a name, an owner and an obvious next action.
Variance: will we land the number?
8. Close-date slippage
The number and value of deals whose expected close date moved out this week. One move can be normal; a second move is a warning that the buyer hasn’t committed to a date. Repeated slippage inflates coverage and is one of the most common reasons a forecast that looked safe in week six misses in week thirteen.
9. Forecast vs actual
Each week, record the committed forecast for the quarter and how it changed from last week. At quarter end, compare the forecast made at fixed points (say week four and week eight) with what closed. The size and direction of that gap matter more than any single call: a team that is always optimistic by 20% needs a different fix from one that swings both ways.
10. Net revenue retention
For a SaaS business, revenue from existing customers belongs in the same review as new business. Net revenue retention (NRR) is a monthly or quarterly figure, so the weekly view is its leading signals: renewals due in the next 90 days that look at risk, and open expansion pipeline. In SaaS Capital’s 2025 retention survey of more than 1,000 private B2B SaaS companies, median NRR was 101% and median gross revenue retention 91% (SaaS Capital, 2025).
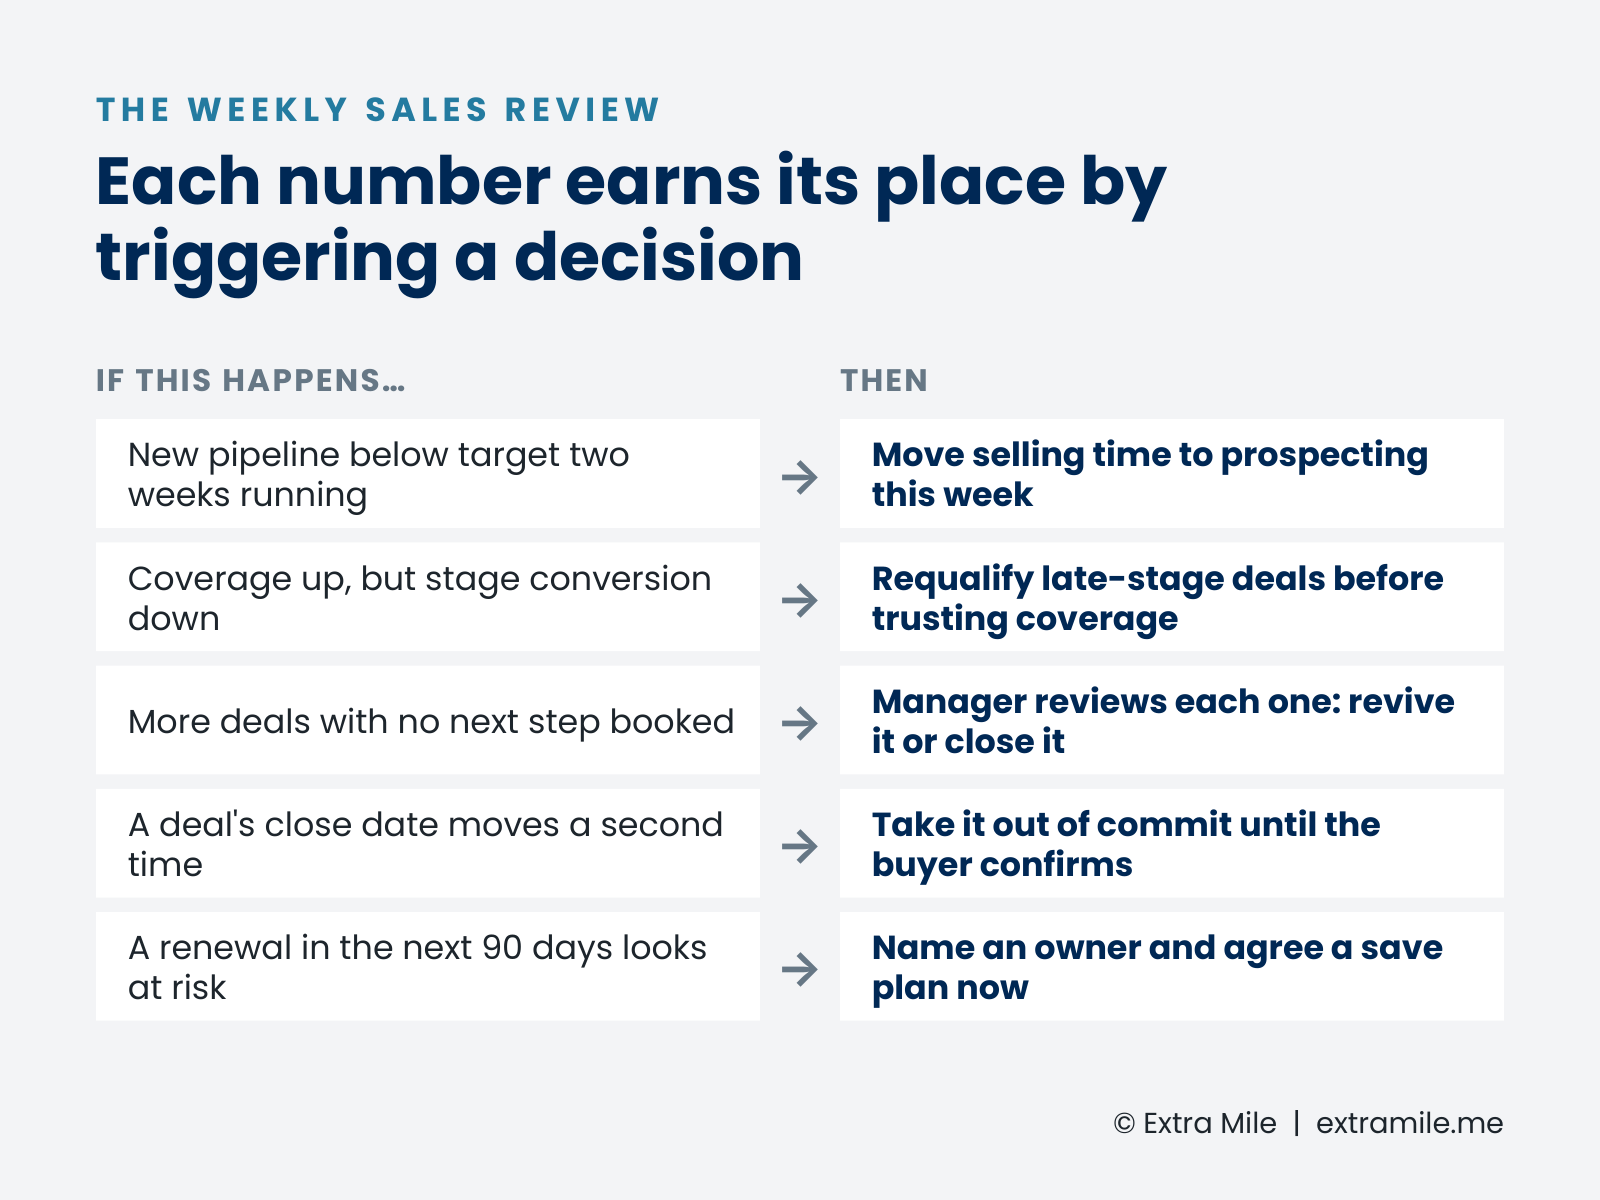
The same survey found that companies in the 110 to 120% NRR band grew 9 percentage points faster than those at 100 to 110%. The data is self-reported and shows correlation, not cause, but it is a strong reason to keep existing customers on the weekly agenda.
How to review B2B sales KPIs in 30 minutes a week
The review works when it runs at the same time each week, uses one CRM view and focuses on exceptions. Reps update their deals before the meeting, not during it. A simple agenda:
- 10 minutes on creation: metrics 1 to 3, against the weekly target.
- 10 minutes on deals: stalled and slipping deals only (metrics 7 and 8), each with an owner and a next step.
- 10 minutes on the call: the forecast, conversion and win-rate trends, renewals at risk and the decisions for the week.
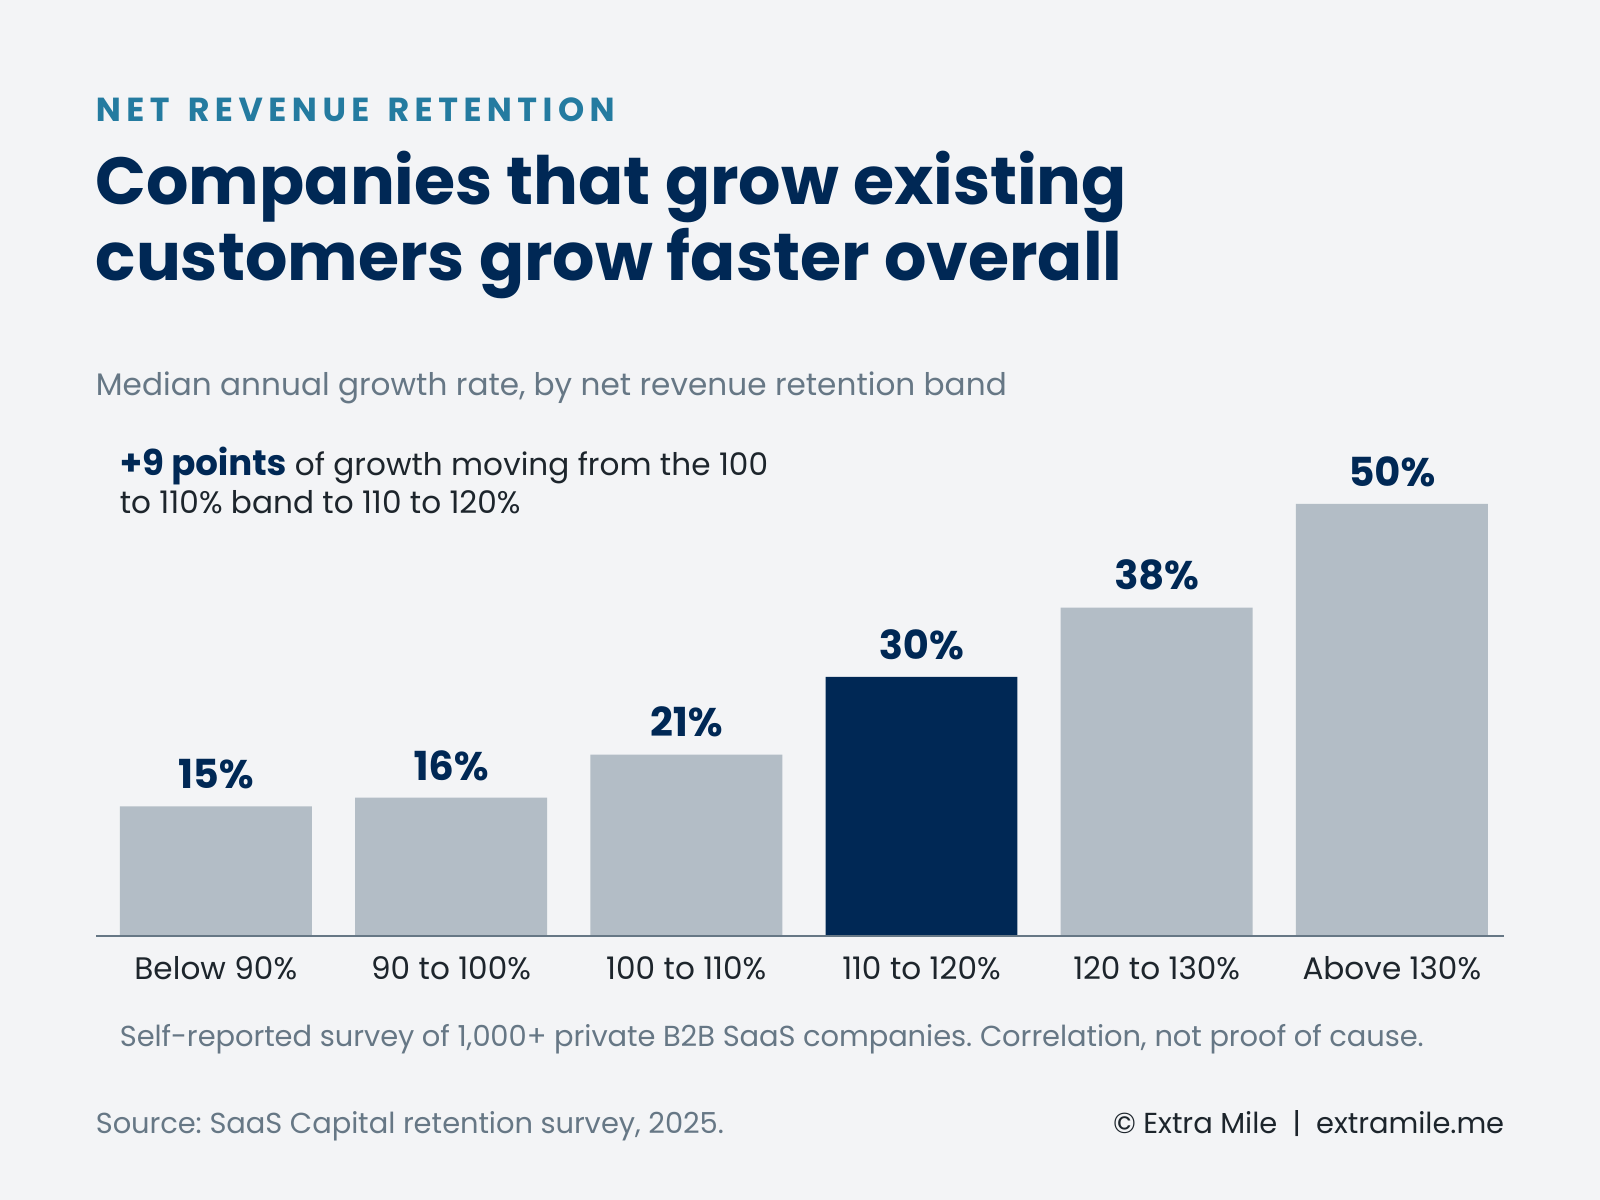
Every metric should be able to trigger a specific action. If a number has never led to a decision, move it to the monthly review.
Equally useful is deciding what to leave out. Call and email counts help diagnose a problem with metric 2 but don’t belong in a weekly leadership review. Neither do lead volumes that never reach qualification, or per-rep quota attainment halfway through a quarter.
If you are still the company’s main closer, this review is also how you hand over: it gives a new sales leader the same view you have. Our guide to moving beyond founder-led sales covers the other steps in that transition.
Start with definitions, not a new dashboard
Most weak sales reviews are definition problems in disguise. Agree what each stage means, what makes a deal qualified and what counts as a stalled deal, then build the ten B2B sales KPIs on top. The dashboard is the last step, and usually the easiest.
If your dashboard isn’t changing decisions, Extra Mile can help you set the definitions, clean up the stages and run the weekly rhythm. Discuss your revenue engine.
Sources and further reading
- Salesloft: 2026 US Revenue Benchmark Report (vendor research, survey of 500 US sales and revenue leaders, September 2026)
- Ebsta: 2025 GTM Benchmarks Report (vendor research, 655,000 opportunities, April 2025)
- RepVue: Cloud Sales Index, Q3 2025 (self-reported ratings, 249 US cloud companies)
- SaaS Capital: SaaS Retention Benchmarks for Private B2B Companies (self-reported survey, 2025)